
Detailed Balance (DB) Charts
Figures last updated: on July 9, 2026 by Larissa Blom.
The figures shown below provide an up-to-date comparison between world-record solar cell efficiencies for different materials and the fundamental detailed balance efficiency limit.
The plots for single-junction efficiencies may be used with attribution to both this website and the following article:
Photovoltaic materials – present efficiencies and future challenges
A. Polman, M. Knight, E.G. Garnett, B. Ehrler, and W.C. Sinke, Science 352, 307 (2016). DOI: 10.1126/science.aad4424.
The plots for multi-junction efficiencies may be used with attribution to both this website and the following article:
Photovoltaics reaching for the Shockley-Queisser limit
B. Ehrler, E. Alarcón-Lladó, S.W. Tabernig, T. Veeken, E.C. Garnett, and A. Polman, ACS Energy Letters 5, 9 (2020). DOI: 10.1021/acsenergylett.0c01790.
Efficiencies relative to the detailed balance limit
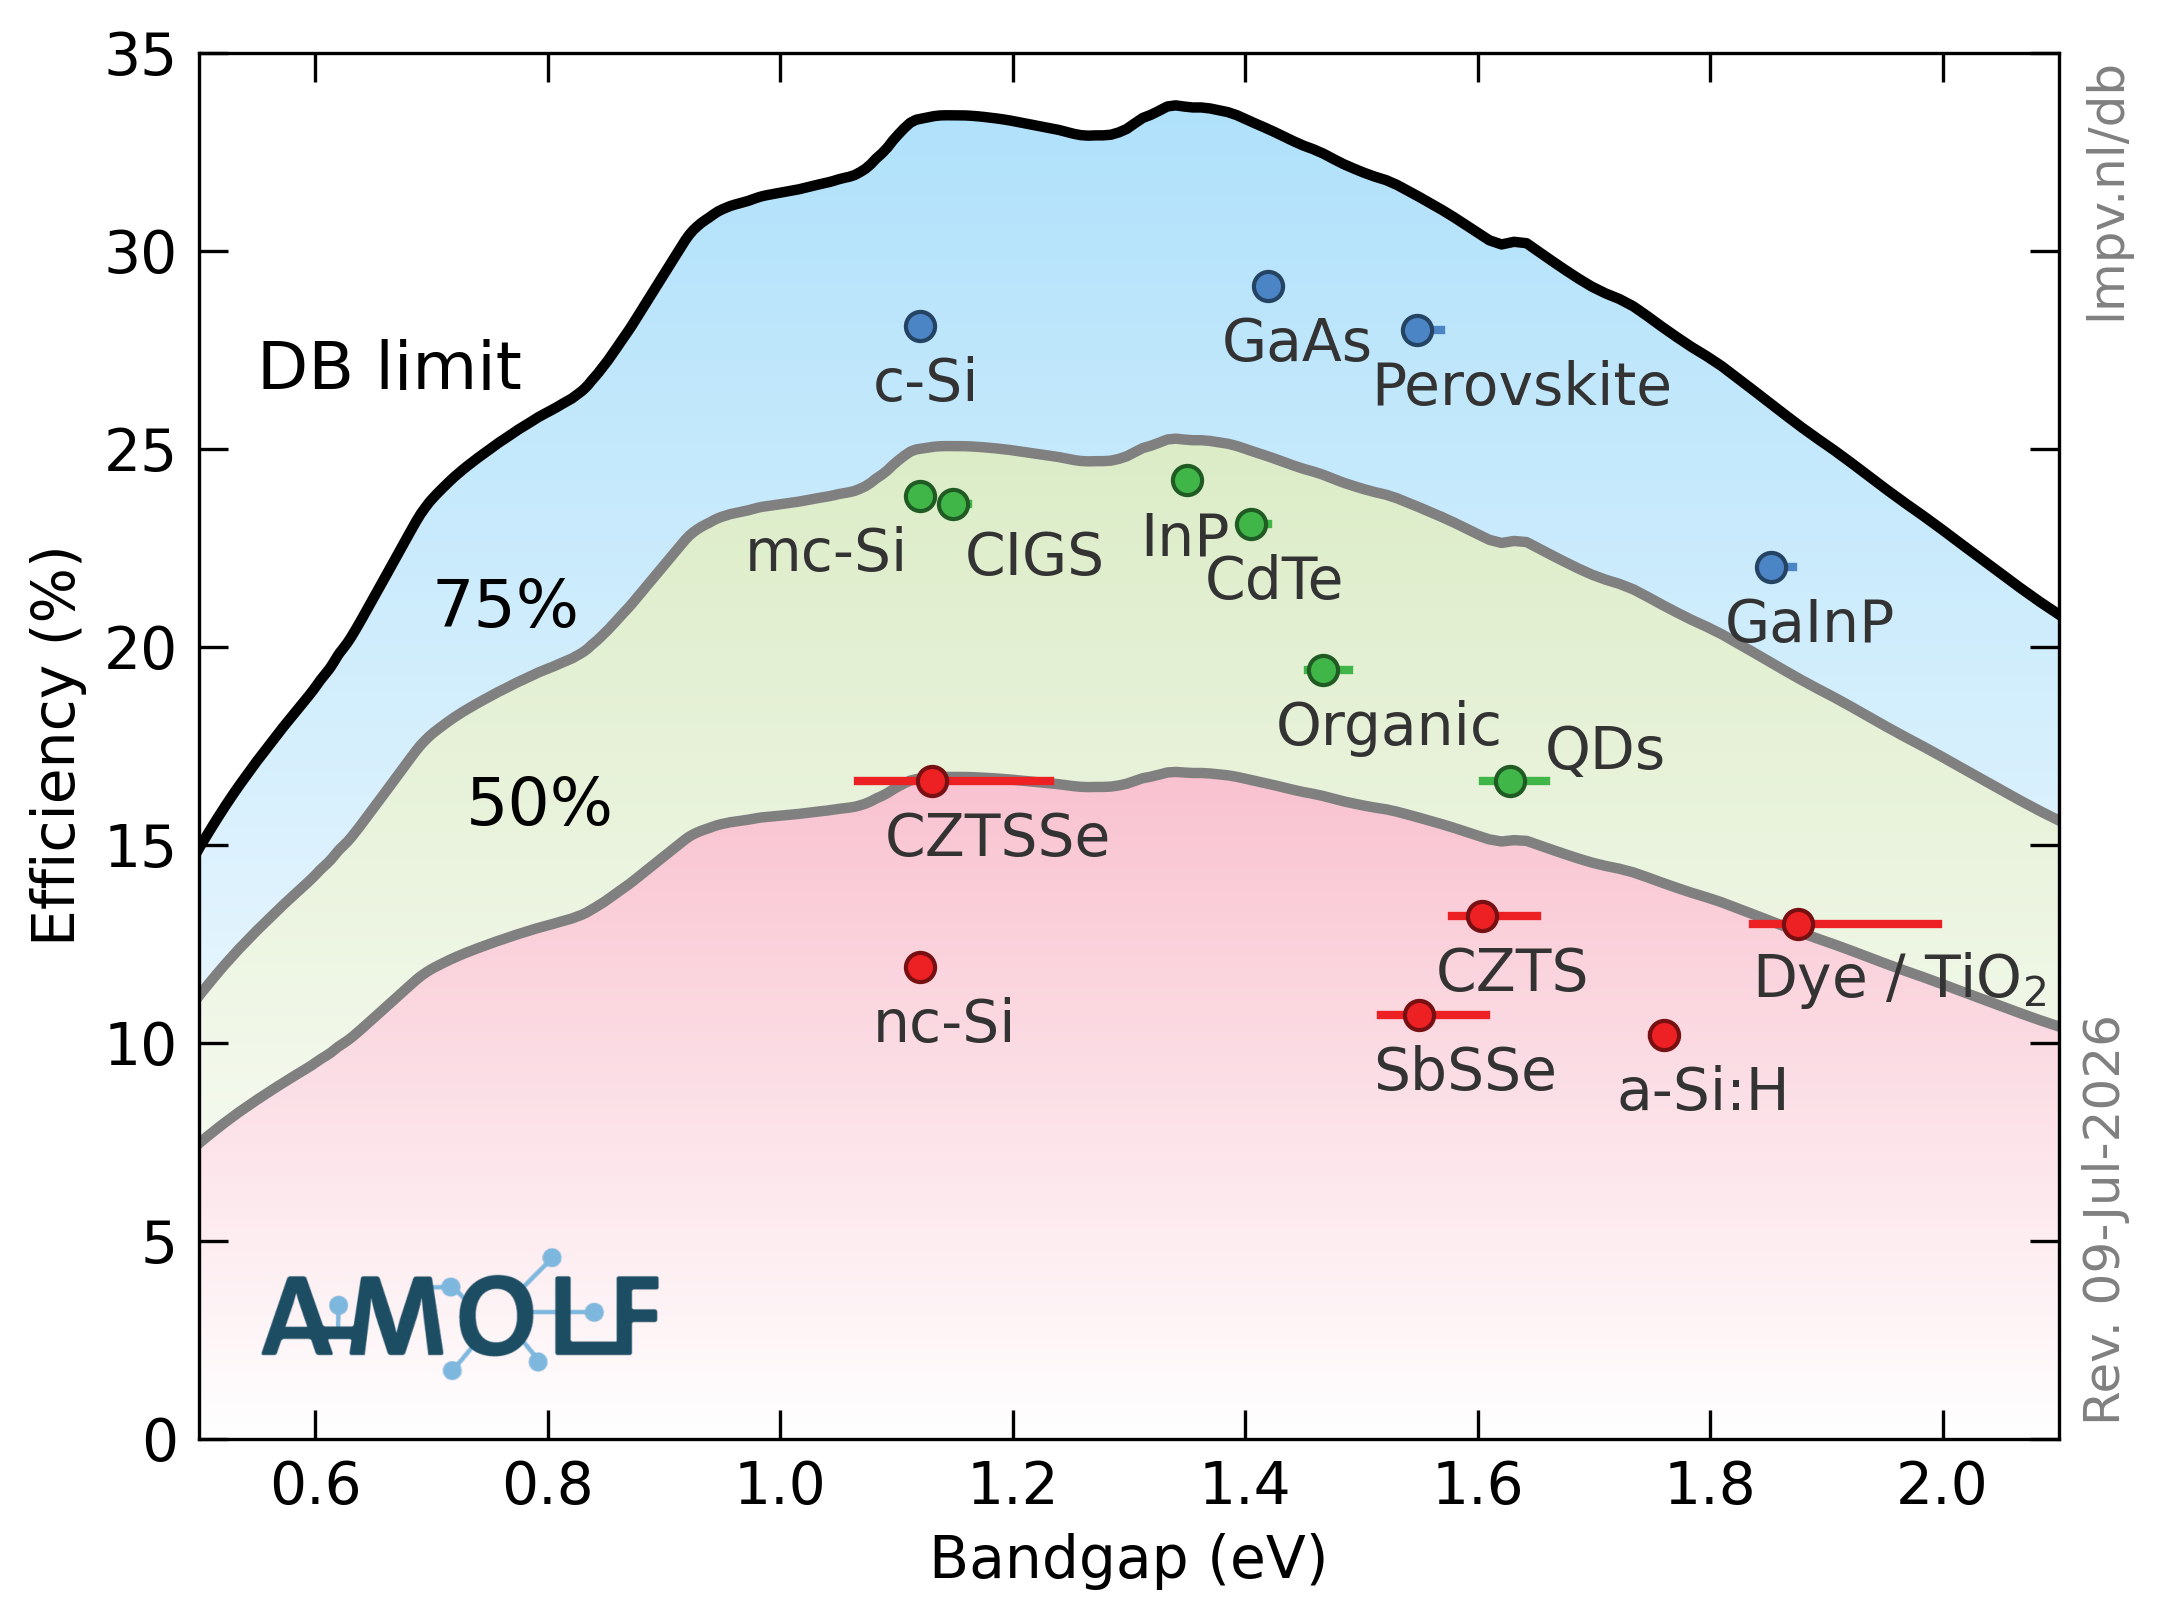
Fraction of the detailed-balance limit (black line) achieved by record-efficiency cells, gray lines showing 75% and 50% of the limit.
Optical and electrical fractions
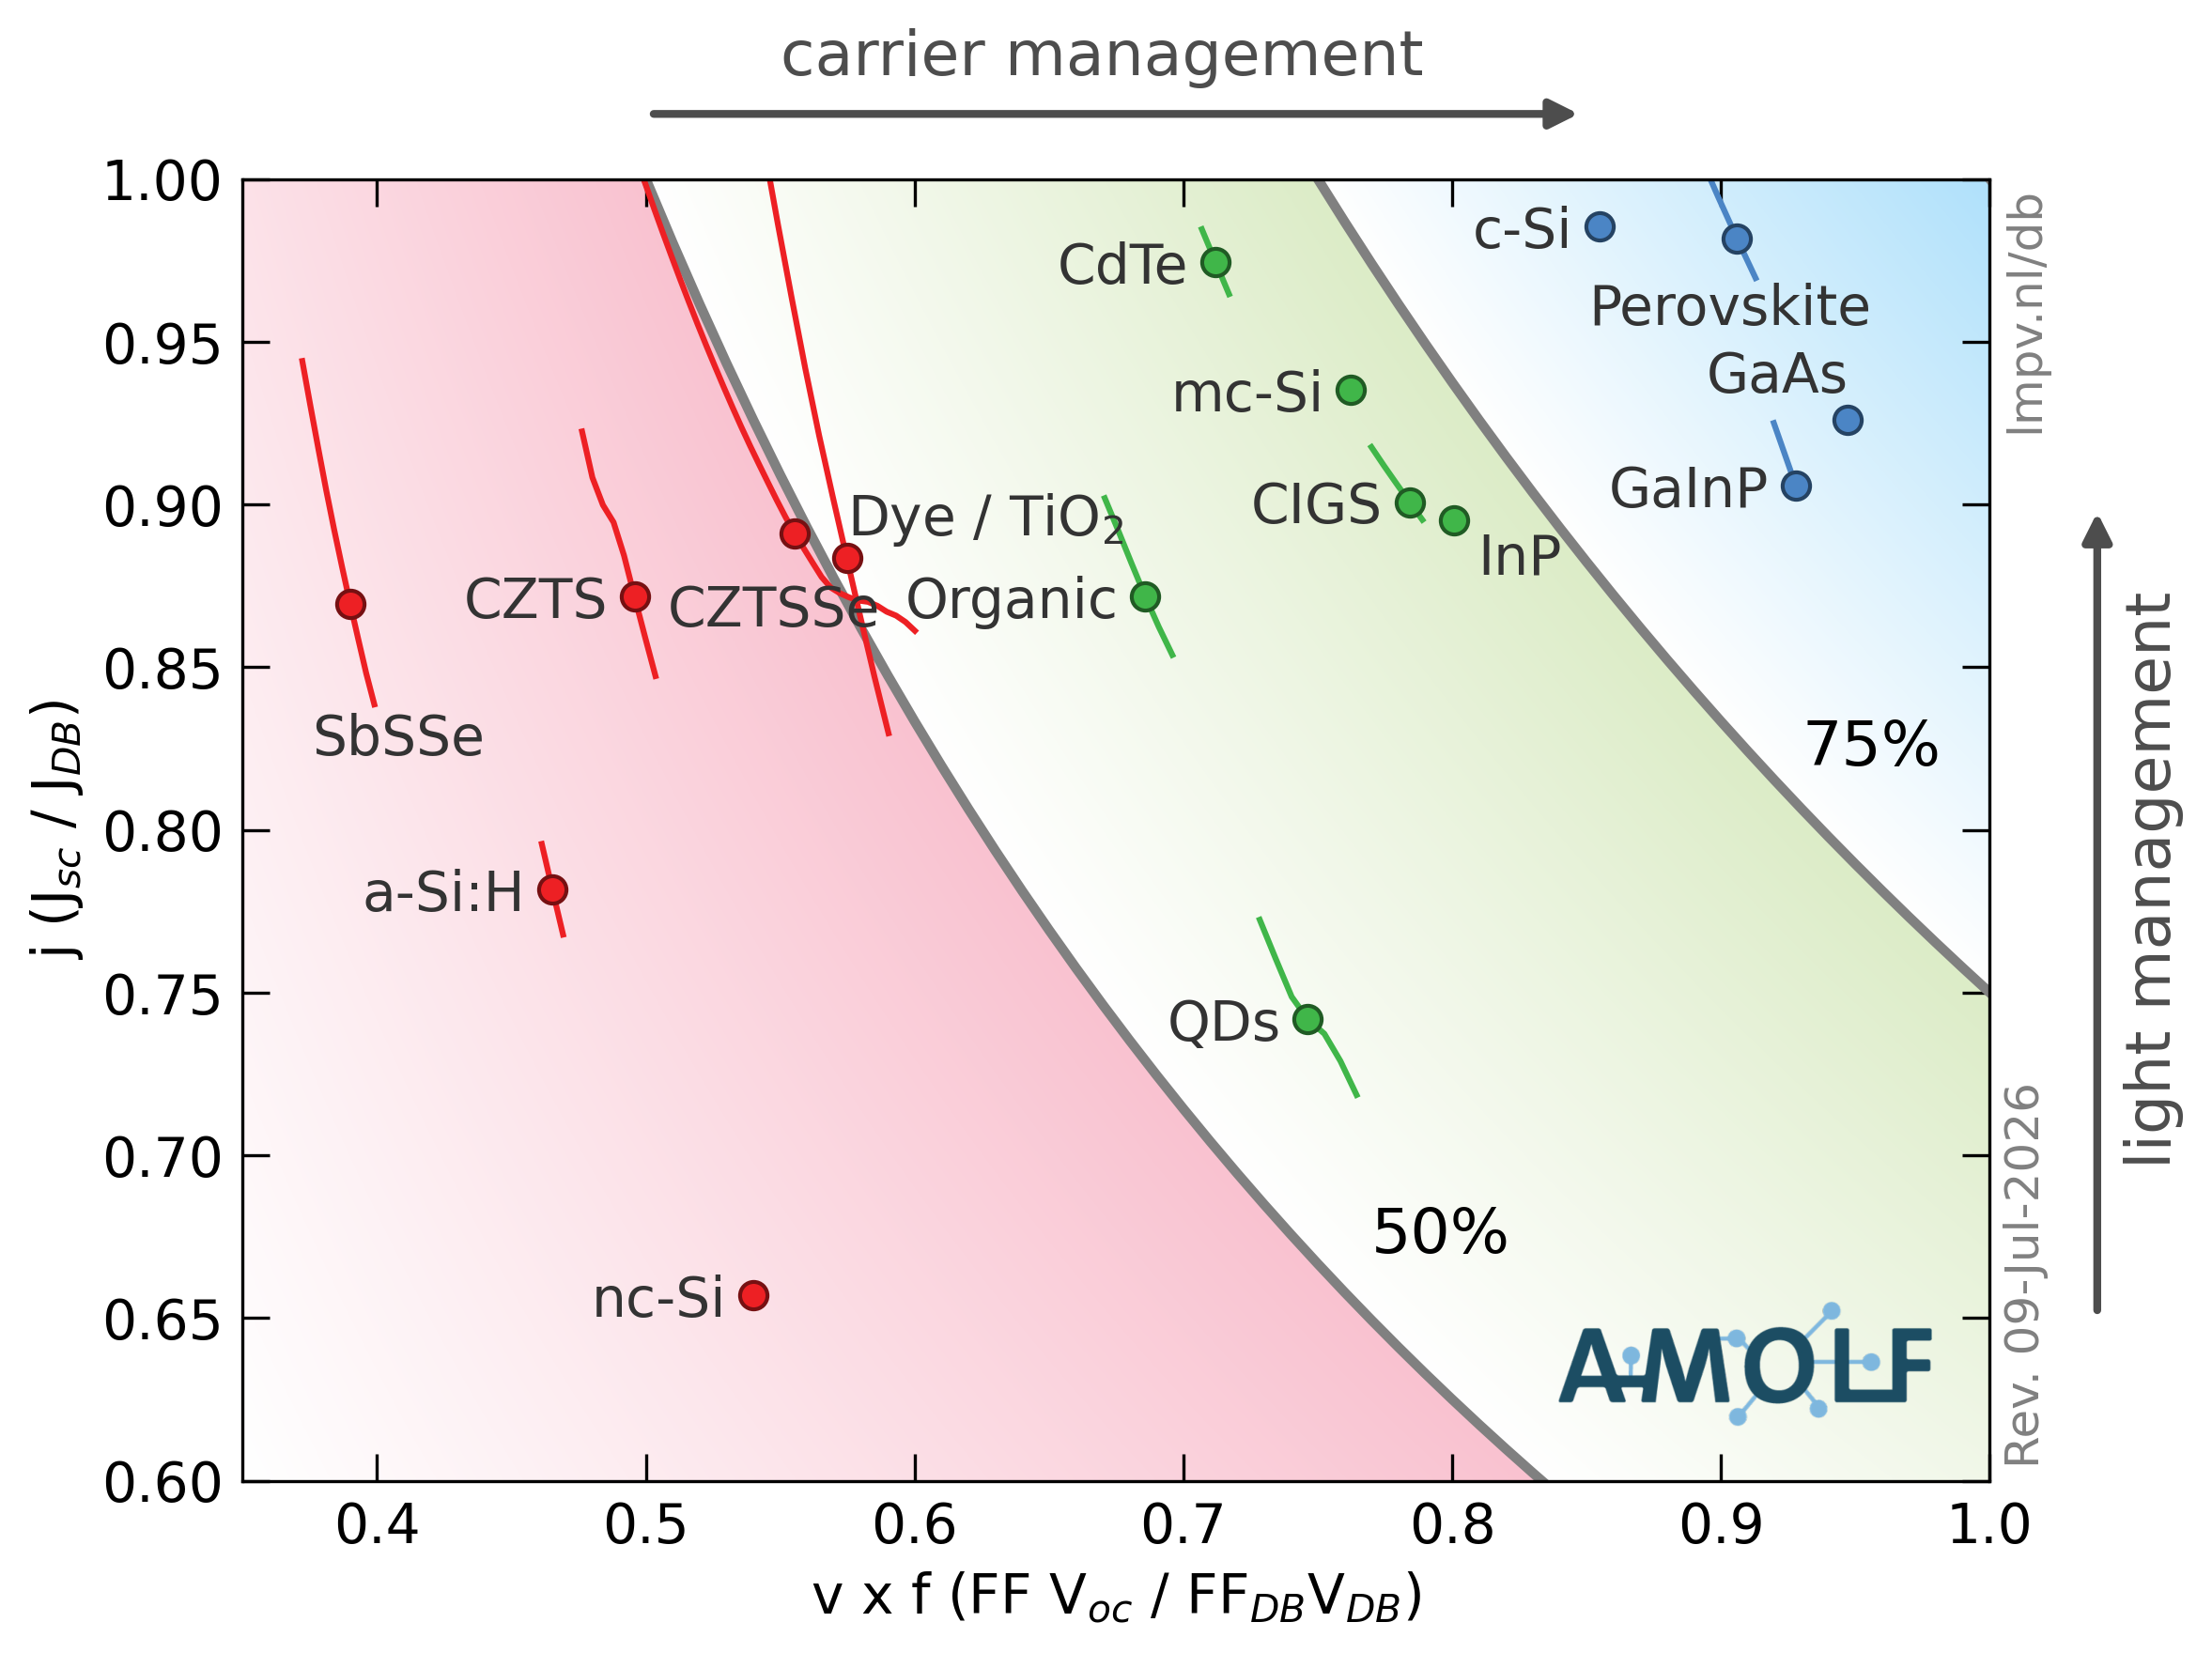
The current ratio j = Jsc/ JDB plotted versus the product of the voltage and fill factor fractions (v x f = FF Voc / FFDB VDB) for record-efficiency cells. The lines around some data points correspond to a range of band gaps taken in the detailed balance calculations according to uncertainty in the band gap of the record cell.
Current, voltage, and FF
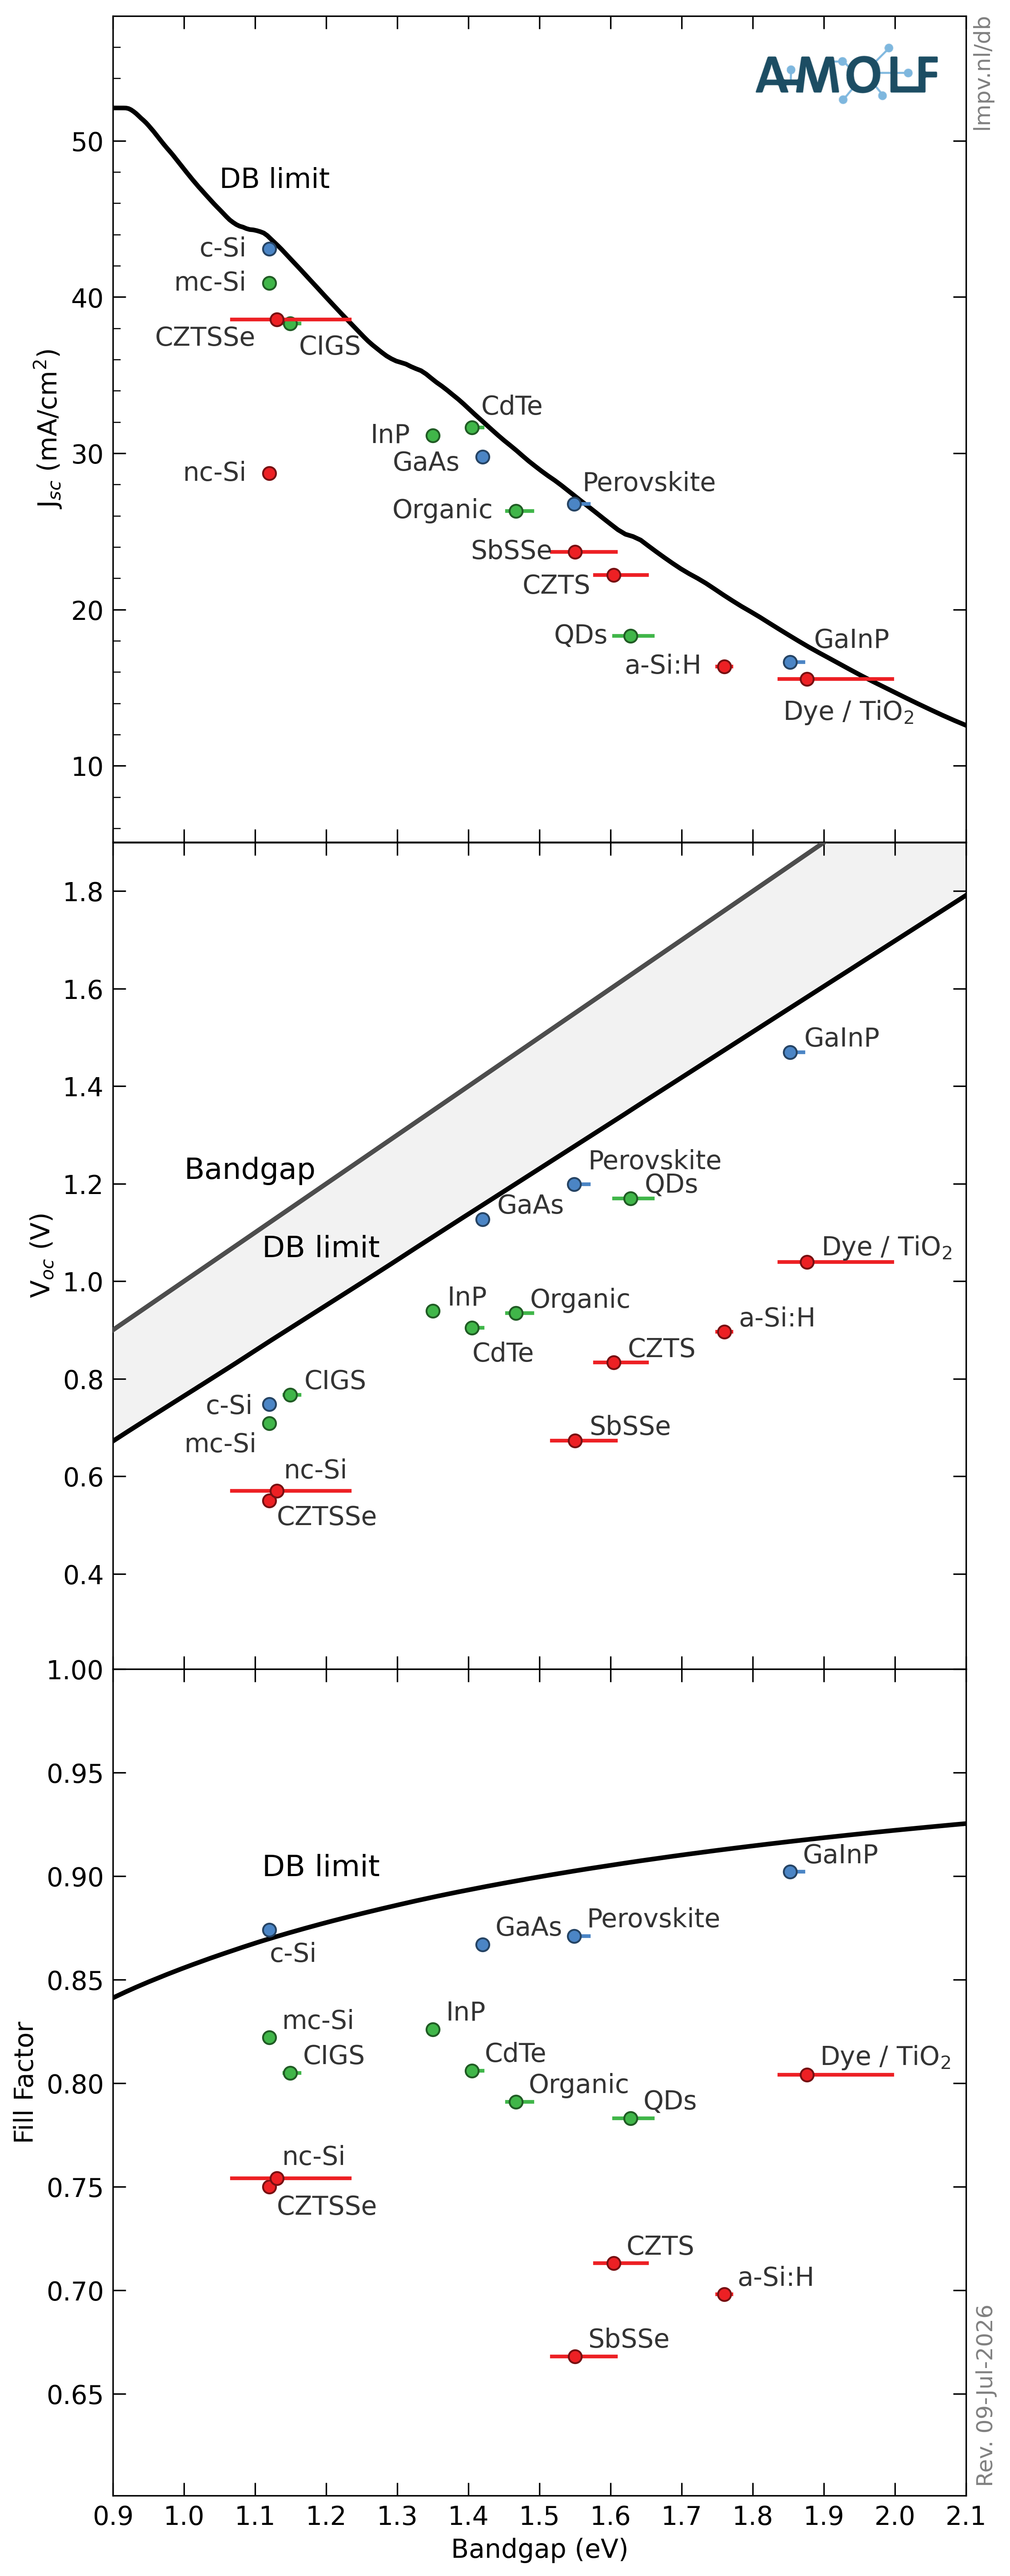
Single-junction solar cell parameters are shown as a function of band gap energy according to the detailed balance limit (solid lines) and experimental values for record-efficiency cells. Panel 1: Short-circuit current Jsc. Panel 2: Open-circuit voltage Voc. The voltage corresponding to the band gap is shown for reference, with the voltage gap Vg–VDB indicated by the gray shaded region. Panel 3: Fill factor FF = (JmpVmp)/(VocJsc). All data are for standard AM1.5 illumination at 1000 W/m2.
Optical and electrical fractions for selected tandem solar cells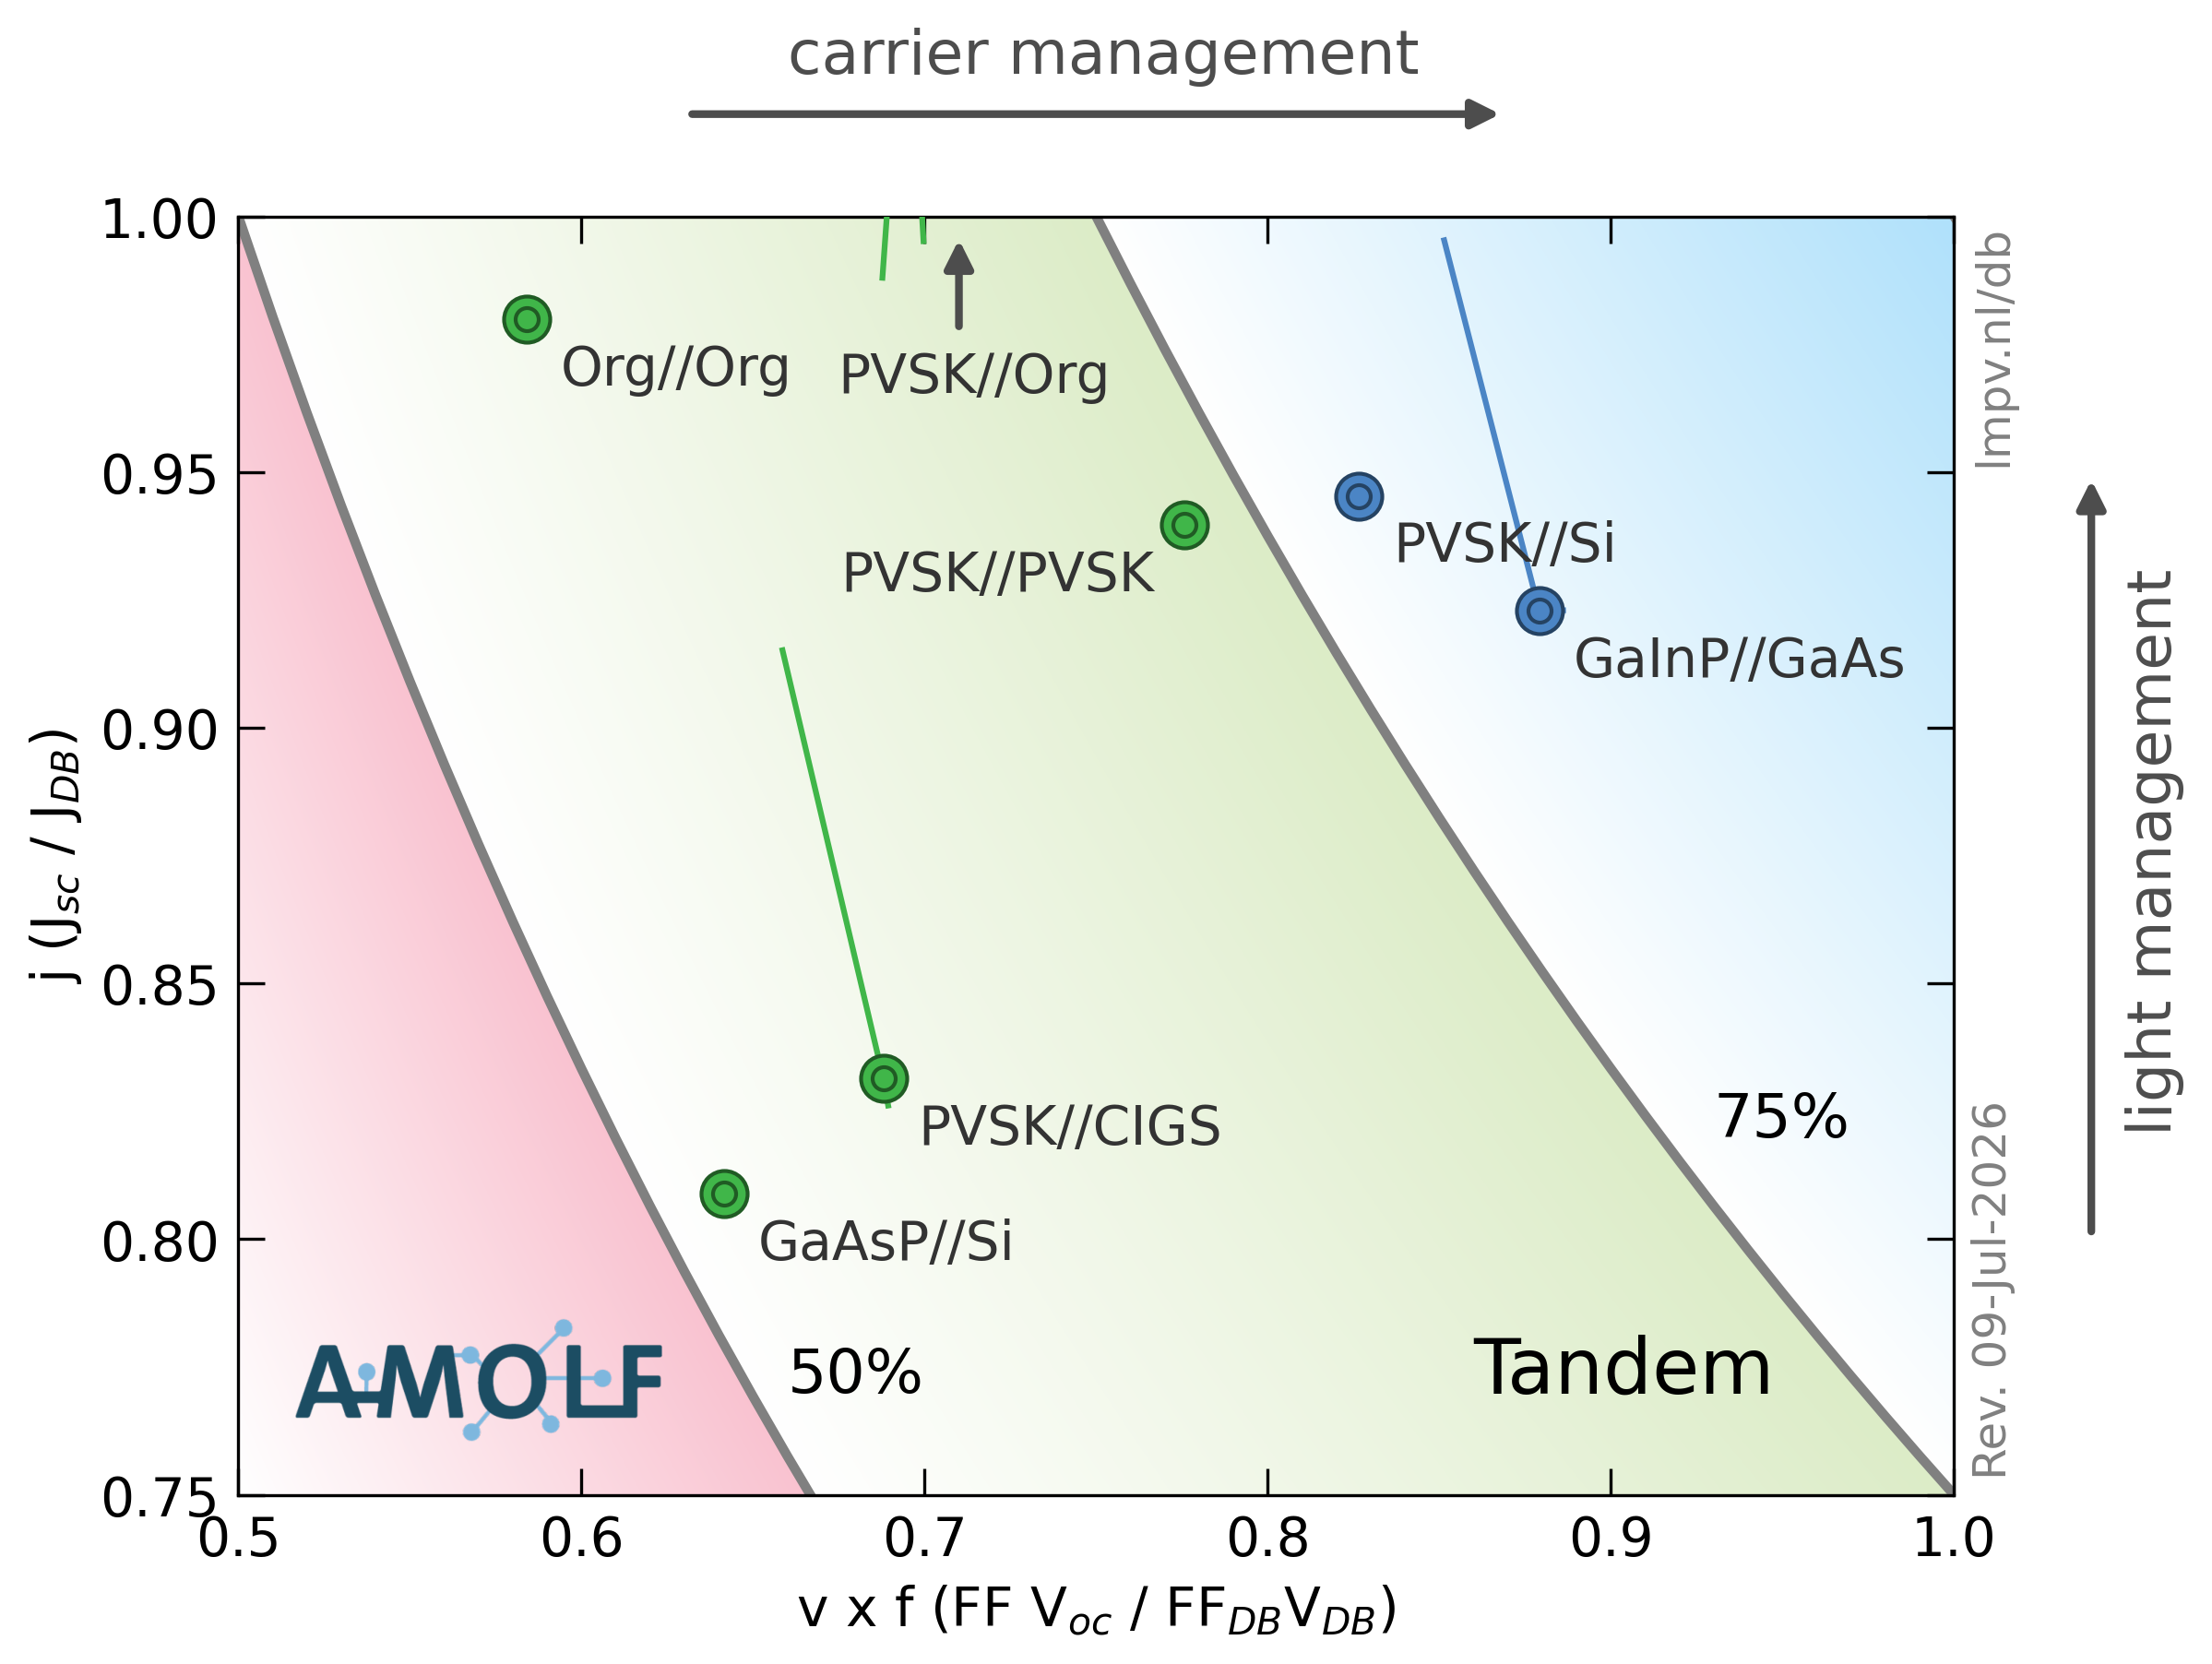
The current ratio j = Jsc/ JDB plotted versus the product of the voltage and fill factor fractions (v x f = FF Voc / FFDB VDB) for record-efficiency cells. The labels correspond to the top//bottom subcell materials of the tandem cell.
References for record-efficiency cells in the updated figures
Crystalline silicon
- Performance parameters (efficiency 28.1%) (updated July 2026):
Solar cell efficiency tables (version 68)
A. Green et al., Joule, 10 (2026). - Cell fabrication:
Silicon Solar Cells with Hybrid Back Contacts
G. Wang et al., Nature 647, 369–374 (2025).
Multicrystalline silicon
- Performance parameters (efficiency 23.8%) (updated July 2020):
Solar cell efficiency tables (version 56)
M. A. Green et al., Prog. Photovolt: Res. Appl. 28, 629– 638 (2020). - Cell fabrication
CANADIAN SOLAR SETS A 23.81% CONVERSION EFFICIENCY WORLD RECORD FOR N-TYPE LARGE AREA MULTI-CRYSTALLINE SILICON SOLAR CELL
GUELPH, Ontario, Mar. 06, 2020 /PRNewswire/Canadian Solar Inc.
Amorphous silicon
- Performance parameters (efficiency 10.2%) (original, April 2016):
Solar cell efficiency tables (version 45)
M. A. Green et al., Prog. Photovolt: Res. Appl. 23, 1-9 (2014). - Cell fabrication:
Development of Highly Stable and Efficient Amorphous Silicon Based Solar Cells
T. Matsui et al., Proc. 28th European Photovoltaic Solar Energy Conference, 2213–2217 (2013).
Nanocrystalline silicon
- Performance parameters (efficiency 11.9%) (updated September 2017):
Solar cell efficiency tables (version 50)
M. A. Green et al., Prog. Photovolt: Res. Appl. 25, 668-676 (2017). - Cell fabrication:
High-efficiency microcrystalline silicon solar cells on honeycomb textured substrates grown with high-rate VHF plasma-enhanced chemical vapor deposition
H. Sai et al., Jpn. J. Appl. Phys. 54, 08KB05 (2015).
GaAs
- Performance parameters (efficiency 29.1%) (updated June 2019):
Solar cell efficiency tables (version 53)
M. A. Green et al., Prog. Photovolt: Res. Appl. 27, 3-12 (2019). - Cell fabrication:
Highly efficient GaAs solar cells by limiting light emission angle
E. D. Kosten et al., Light Sci. Appl. 2, e45 (2013).
InP
- Performance parameters (efficiency 24.2%) (updated September 2017):
Solar cell efficiency tables (version 50)
M. A. Green et al., Prog. Photovolt: Res. Appl. 25, 668-676 (2017). - Cell fabrication:
Advanced Ultra High Performance InP Solar Cells
NREL Technology (23 June 2016).
GaInP
- Performance parameters (efficiency 22.0%) (updated October 2019):
Solar cell efficiency tables (version 54)
M. A. Green et al., Prog. Photovolt: Res. Appl. 27, 565-575 (2019). - Cell fabrication:
NREL, private communication, 22 May 2019. (according to M. A. Green et al., Prog. Photovolt: Res. Appl. 27, 565-575 (2019))
CdTe
- Performance parameters (efficiency 23.1%) (updated November 2024):
Solar cell efficiency tables (version 65)
M. A. Green et al., Prog. Photovolt: Res. Appl. (2024). - Cell fabrication:
No specifics available yet.
CIGS
- Performance parameters (efficiency 23.6%) (updated July 2023):
Solar cell efficiency tables (version 62)
M. A. Green et al., Prog. Photovolt: Res. Appl. 31, 651-663 (2023). - Cell fabrication:
State of the art and future prospects of thin film CIGS solar cells
University of Luxembourg Physics Colloquium (10 May 2023).
CZTSSe
- Performance parameters (efficiency 16.6%) (updated March 2026):
Solar cell efficiency tables (version 67)
M. A. Green et al., Prog. Photovolt: Res. Appl. (2026). - Cell fabrication
Control of the phase evolution of kesterite by tuning of the selenium partial pressure for solar cells with 13.8% certified efficiency
J. Zhou et al., Nat. Ener. 8, 526-535 (2023)
CZTS
- Performance parameters (efficiency 13.2%) (updated November 2024):
Solar cell efficiency tables (version 65)
M. A. Green et al., Prog. Photovolt: Res. Appl. (2024). - Cell fabrication:
Cd-Free Cu2ZnSnS4 solar cell with an efficiency greater than 10% enabled by Al2O3 passivation layers
X. Cui et al., Energy Environ. Sci. 12, 2751-2764 (2019)
Dye/TiO2
- Performance parameters (efficiency 13.0%) (updated July 2023):
Solar cell efficiency tables (version 62)
M. A. Green et al., Prog. Photovolt: Res. Appl. 31, 651-663 (2023). - Cell fabrication:
Hydroxamic acid pre-adsorption raises the efficiency of cosensitized solar cells
Y. Ren et al., Nature 613, 60-65 (2023).
Organic
- Performance parameters (efficiency 19.4%) (updated March 2026):
Solar cell efficiency tables (version 67)
M. A. Green et al., Prog. Photovolt: Res. Appl. (2026). - Cell fabrication:
A dendritic hexamer acceptor enables 19.4% efficiency with exceptional stability in organic solar cells
T. Jia et al., Nat. Commun. 16, Article 56225 (2025).
Quantum-dots
- Performance parameters and cell fabrication (efficiency 16.6%) (updated July 2020):
Ligand-assisted cation-exchange engineering for high-efficiency colloidal Cs1−xFAxPbI3 quantum dot solar cells with reduced phase segregation
Hao, M., Bai, Y., Zeiske, S. et al., Nat. Energy 5, 79–88 (2020).
Perovskite
- Performance parameters (efficiency 28.0%) (updated July 2026):
Solar cell efficiency tables (version 68)
M. A. Green et al., Joule. 10 (2026). - Cell fabrication:
No specifics available yet.
Antimony Selenosulfide (SbSSe)
- Performance parameters (efficiency 10.7%) and cell fabrication (updated November 2024):
Regulating Energy Band Alignment via Alkaline Metal Fluoride Assisted Solution Post-Treatment Enabling Sb2(S,Se)3 Solar Cells with 10.7% Efficiency
Y. Zhao et al., Adv. Energy Mater. 12, 2103015 (2022).
Tandem Solar Cells
Perovskite – Silicon
- Performance parameters (efficiency 35.2%) (updated July2026):
Solar cell efficiency tables (version 68)
A. Green et al., Joule, 10 (2026). - Cell fabrication
No specifics available yet.
Perovskite – CIGS
- Performance parameters (efficiency 25.5%) (updated July 2026):
Solar cell efficiency tables (version 68)
A. Green et al., Joule, 10 (2026). - Cell fabrication:
Improving Perovskite/CIGS Tandem Solar Cells for Higher Power Conversion Efficiency through Light Management and Bandgap Engineering
G. Farias-Basulto et al., ACS Applied Materials & Interfaces, 17(40), 56250-56255. (2026).
Perovskite – Perovskite
- Performance parameters (efficiency 30.1%) (updated July 2024):
Solar cell efficiency tables (version 64)
M. A. Green et al., Prog. Photovolt: Res. Appl. 32, 425-441 (2024). - Cell fabrication:
All-perovskite tandem solar cells with improved grain surface passivation
R. Lin et al., Nature 603, 73-78 (2022).
GaAsP – Si
- Performance parameters (efficiency 23.4%) (included July 2020):
Solar cell efficiency tables (version 57)
A. Green et al., Prog. Photovolt. Res. Appl. 28, 1-13 (2020). - Cell fabrication:
GaAs75P0.25/Si Dual-Junction Solar Cells Grown by MBE and MOCVD
T. Grassman, IEEE Journal of Photovoltaics 6, 326 (2020).
GaInP – GaAs
- Performance parameters (efficiency 32.8%) (included July 2020):
Solar cell efficiency tables (version 57)
A. Green et al., Prog. Photovolt. Res. Appl. 28, 1-13 (2020).
Perovskite – Organic
- Performance parameters (efficiency 25.1%) (updated November 2024):
Solar cell efficiency tables (version 65)
M. A. Green et al., Prog. Photovolt: Res. Appl. (2024). - Cell fabrication
Highly Efficient Perovskite/Organic Tandem Solar Cells Enabled by Mixed-Cation Surface Modulation
X. Wang et al., Adv. Mater., 35, 2305946 (2023).
Organic – Organic
- Performance parameters (efficiency 19.5%) (included August 2022):
A Tandem Organic Photovoltaic Cell with 19.6% Efficiency Enabled by Light Distribution Control
J. Wang et al., Adv. Matter 33, 2102787 (2021). - Cell fabrication
A Tandem Organic Photovoltaic Cell with 19.6% Efficiency Enabled by Light Distribution Control
J. Wang et al., Adv. Matter 33, 2102787 (2021).